The Patch My PC Power BI dashboard can monitor the compliance and deployment of third-party and Microsoft security updates through Configuration Manager.
- Video Guide for Power Bi Dashboard
- Step 1: Requirements
- Step 2: Download and Configure the Report
- Step 3: Exploring the Power BI Report
- Step 4: Updating your Data
Video Guide for Power Bi Dashboard
Optionally, you can also check out the video guide below to learn more about the setup and usage of the Power BI Software Update Dashboard for ConfigMgr.
Step 1: Requirements
To utilize this report, you will need to meet the following requirements.
Required
- Have Power BI Desktop (Free) Installed
- Have the DB Reader Role on the ConfigMgr database
- Our report does not leverage the RBAC views, so Configuration Manager roles will not provide access.
- A copy of the Power BI template, included in this article.
Optional
- Power BI Pro License
- Power BI Gateway server installed and configured
Step 2: Download and Configure the Report
To get started, download the latest Power BI template file for software updates.
Download the Dashboard: PatchMyPC-ConfigMgr-1.0.9
Updated 12/6/2021
| Version Number | Notes |
| 1.0.9 |
|
| 1.0.6 |
|
We present the file in a zipped format, so you will need to extract the template file once downloaded.
Once you’ve downloaded the file, go ahead and open it to get started. Opening the file will present you with three fields to fill in.
- Â MEMCM SQL Server Name
- MEMCM SQL DB Name
- Collection Filter
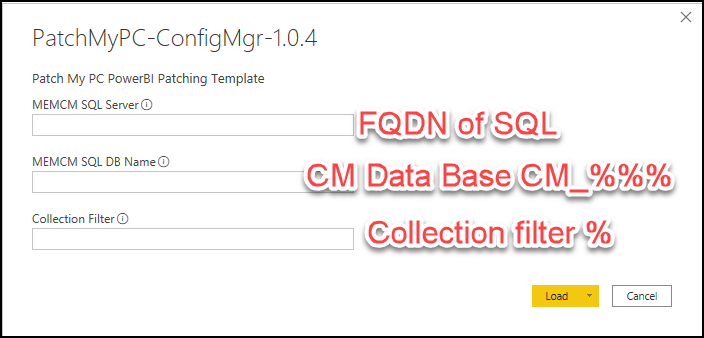
Below is an example of what you might put in each field.
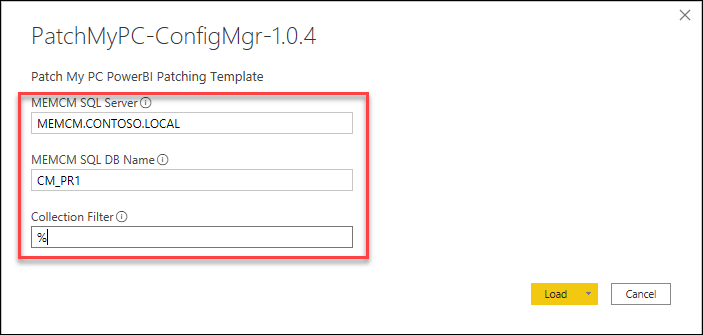
Note: The Percent sign here is used as a wild card to return all machines, related to all collections. You can use this to only return machines from specific collections as needed.
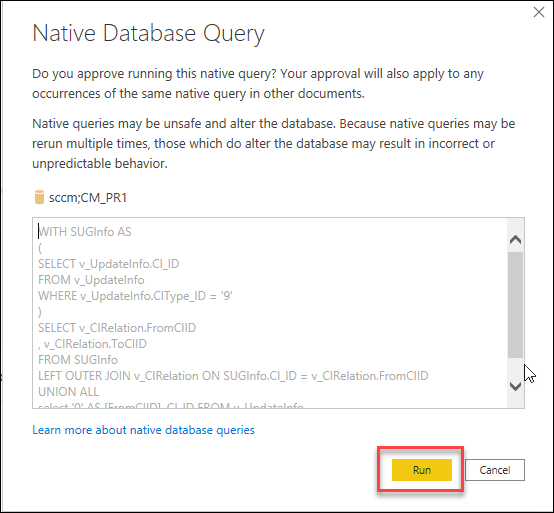
When you first run this report, you will need to authorize the SQL queries to run, assuming that you trust the content of those queries.
You can find the contents of these queries publicly available, along with an explanation behind their logic, on our learning website.
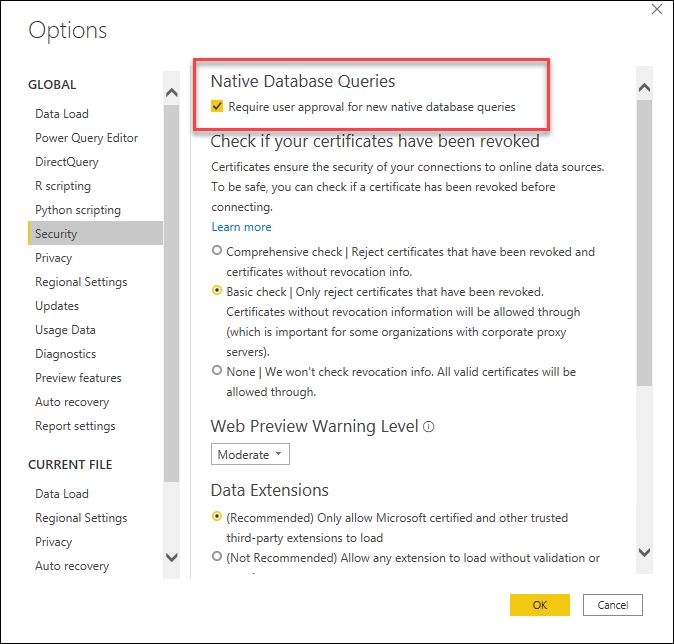
The security setting under the options governs the default behavior of Power BI and, we do not recommend unchecking the pictured option.
Once you have approved all of the queries, the report will load, keep in mind it may take some time based on the size of your environment.
Step 3: Exploring the Power BI Report
The Patch My PC PowerBI dashboard is broken up into three different components. You can navigate through these components by using the tabs located at the bottom of the report.
Compliance Overview
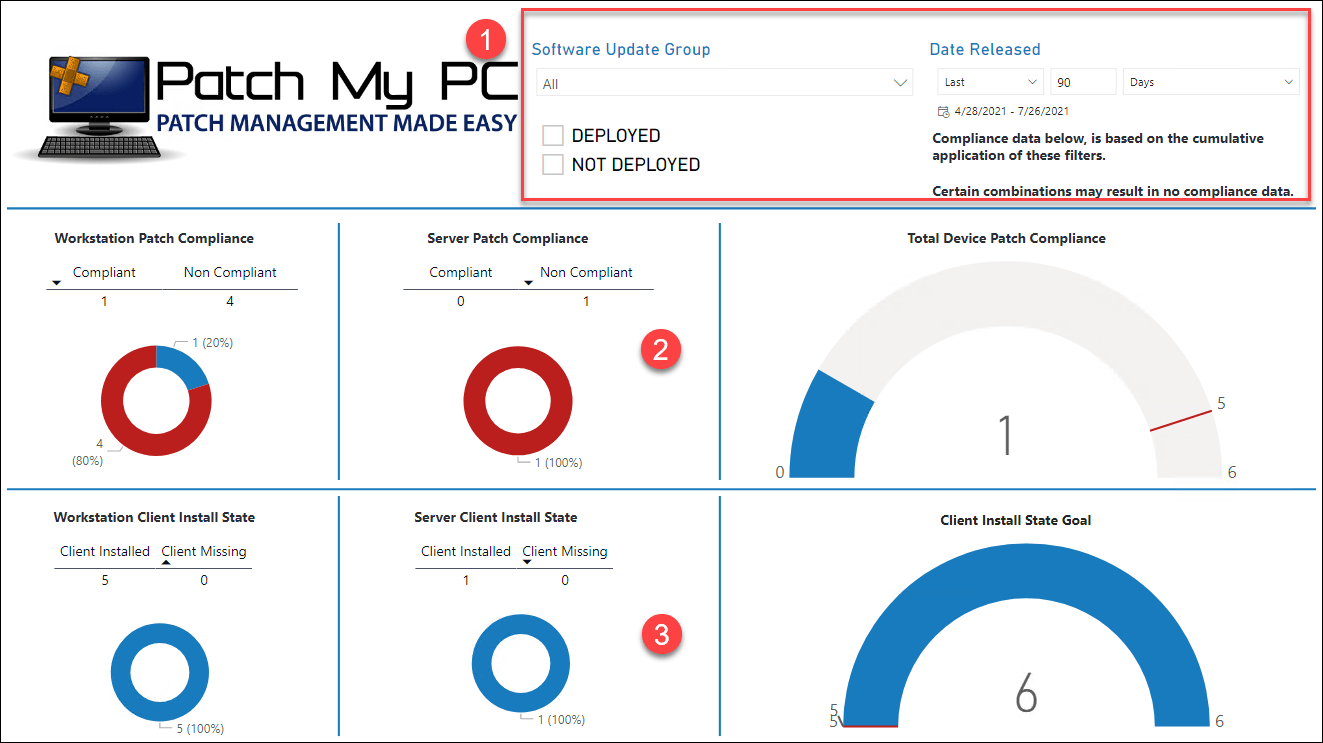
- Filters – This section can be used to filter the report, only to show information about patches released over X date range, patches in a specific software update group, or to only grade based on deployed updates.
- Workstation and server Patch compliance, with a total ring that sets a target of 90%
- Configuration Manager Agent Compliance. This helps find Gaps in your environment for devices that might be missing the agent, therefore not reporting their associated risk.
Workstation Compliance
This report tab is filtered specifically to workstation-only information.
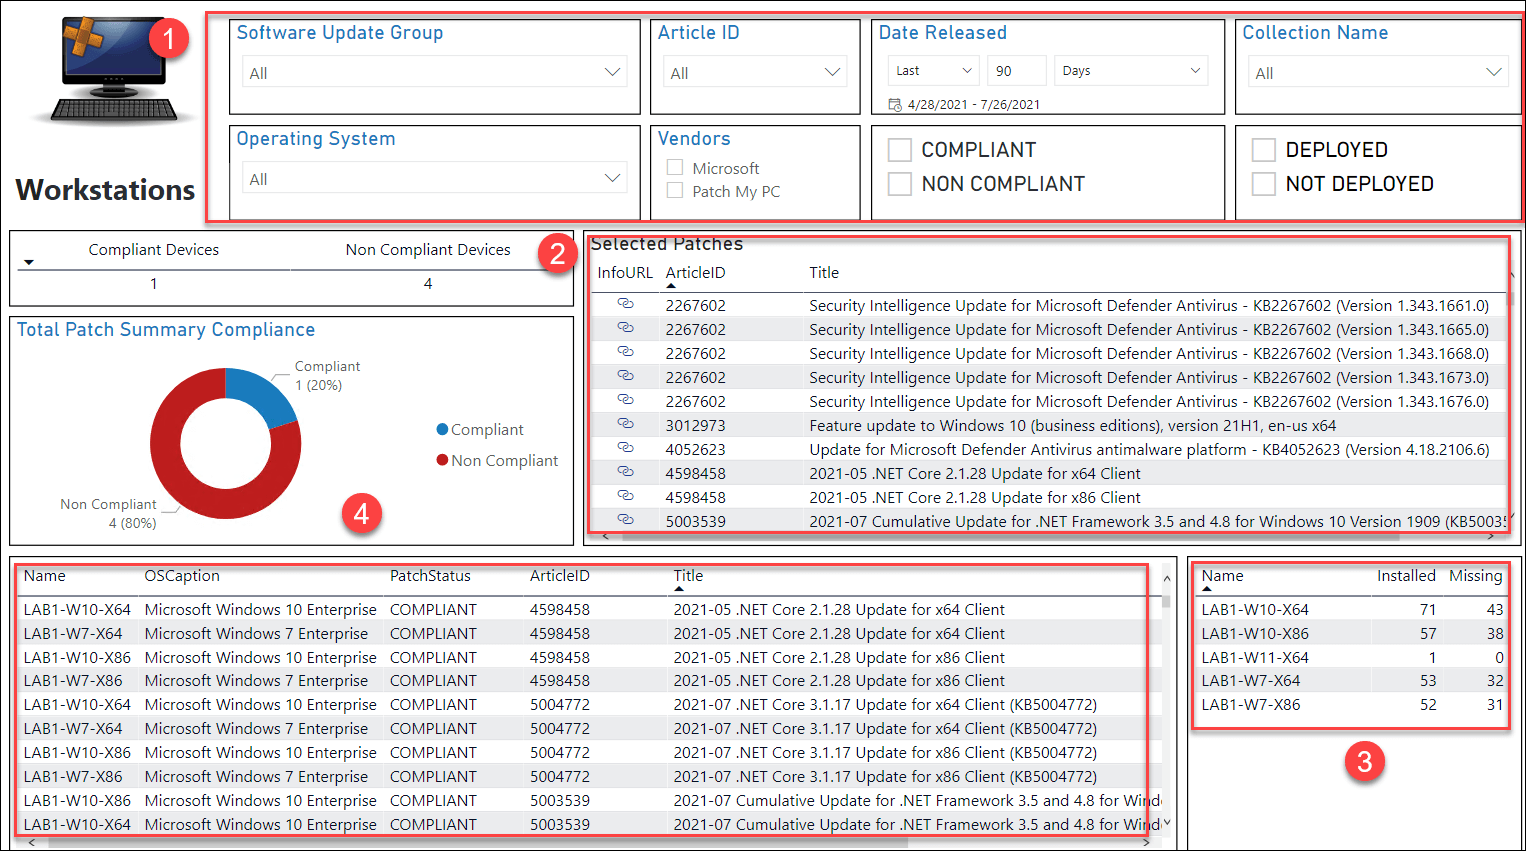
- Filters allow you to filter down to the criteria you care about.
- Currently selected patches you are grading against.
- Running tally of the device’s name and the number of patches missing vs. Installed.
- Detailed information on what that patch is and its current state.
Please note this report was written with the idea of being actionable, and as a result, ‘Unknown’ or ‘fuzzy’ data is largely excluded.
Server Compliance
This report tab is filtered specifically to server-only information.
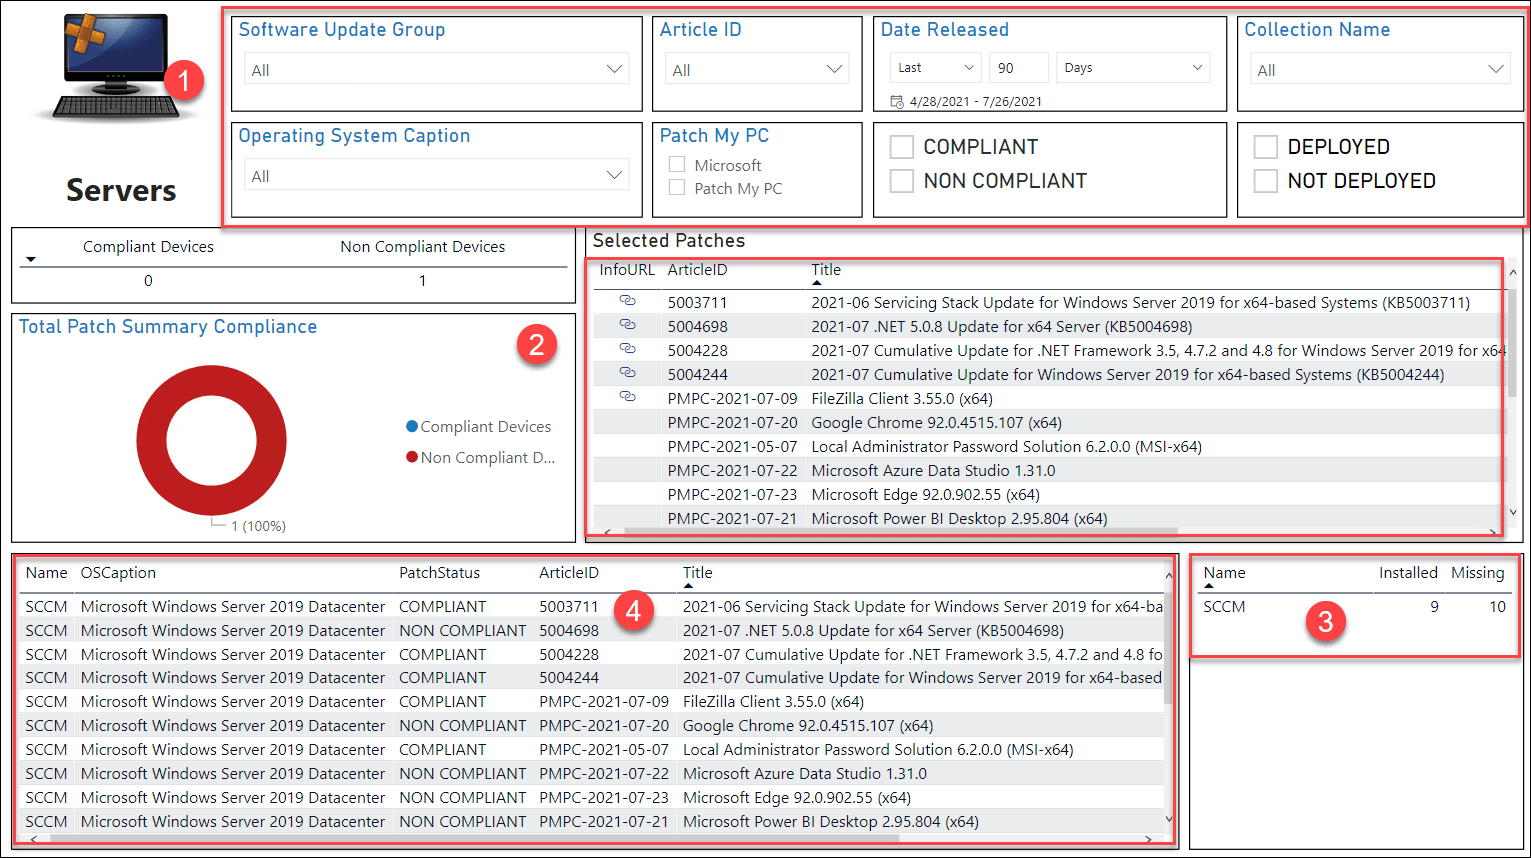
- Filters allow you to filter down to the criteria you care about.
- Currently selected patches you are grading against.
- Running tally of the device’s name and the number of patches missing vs. Installed.
- Detailed information on what that patch is and its current state.
Step 4: Updating your Data
This dataset can be updated in one of two ways. First, you can at any time click ‘refresh‘ from the ribbon in the Power BI desktop app. This report has also been tested with a Power BI gateway and does support automatic refresh if you have a gateway properly set up and configured.
