
Microsoft has quietly improved the Windows device sync experience in Intune. Instead of only sending a push request that tells the device to check in through IC3 and WNS, the portal can now also open a live Sync status window that shows the progress Intune receives back from the service. That change matters because Intune is no longer relying on one single device-side engine. Windows MDM still follows its own path, while Intune Management Extension workloads use a separate path. The portal then pulls those results together into one monitoring pane.
What the New Sync Status pane looks like
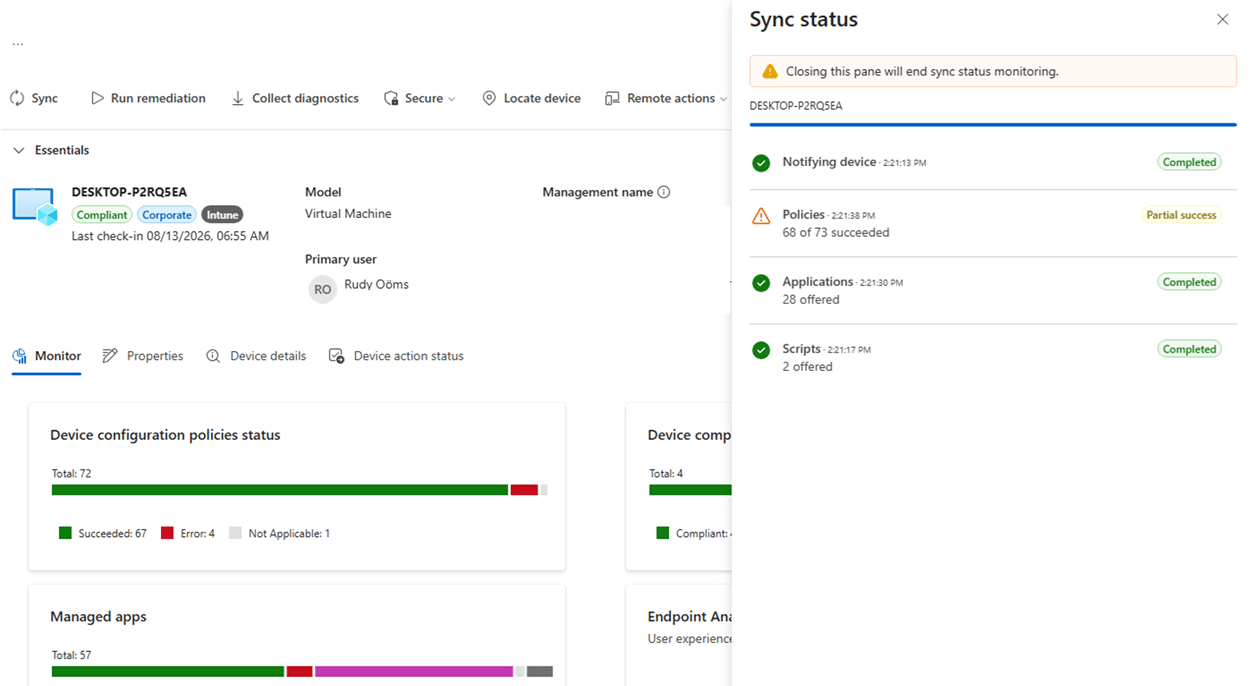
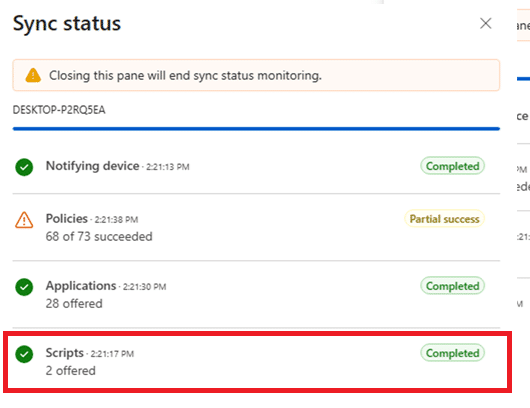
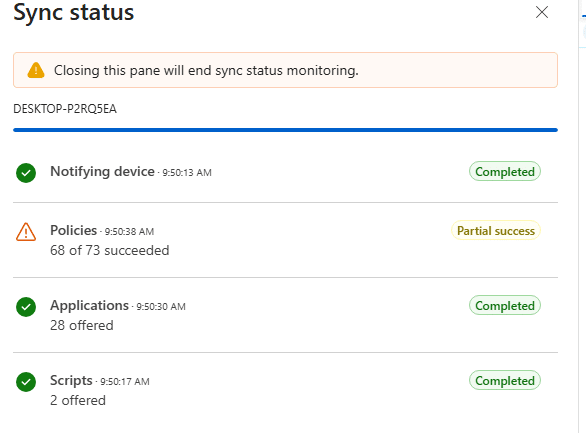
The current pane opens on the right side of the device page after Sync is triggered. In this example below, it shows a completed notification step, a partial success result for Policies, and completed summary rows for Applications and Scripts.
What changed
The key change isn’t just a nicer sync status window. The portal now behaves more like a lightweight monitoring client. It starts the Sync action, opens the pane, and keeps polling for updated status while the action is in progress.
At the same time, the device-side paths are different depending on the workload. Classic Windows MDM still uses WNS and the WindowsMDMPush path. IME workloads use the notification path built around IC3 and Trouter DirectSync. That split is the reason one Sync action can light up different rows in the pane.
The MDM and IME World vs the Status Sync Window
This first diagram is the map for the rest of the article. It shows how one Sync action is accepted, monitored, split into workload-specific paths (2 worlds), correlated by the service, and finally returned to the Sync status pane.
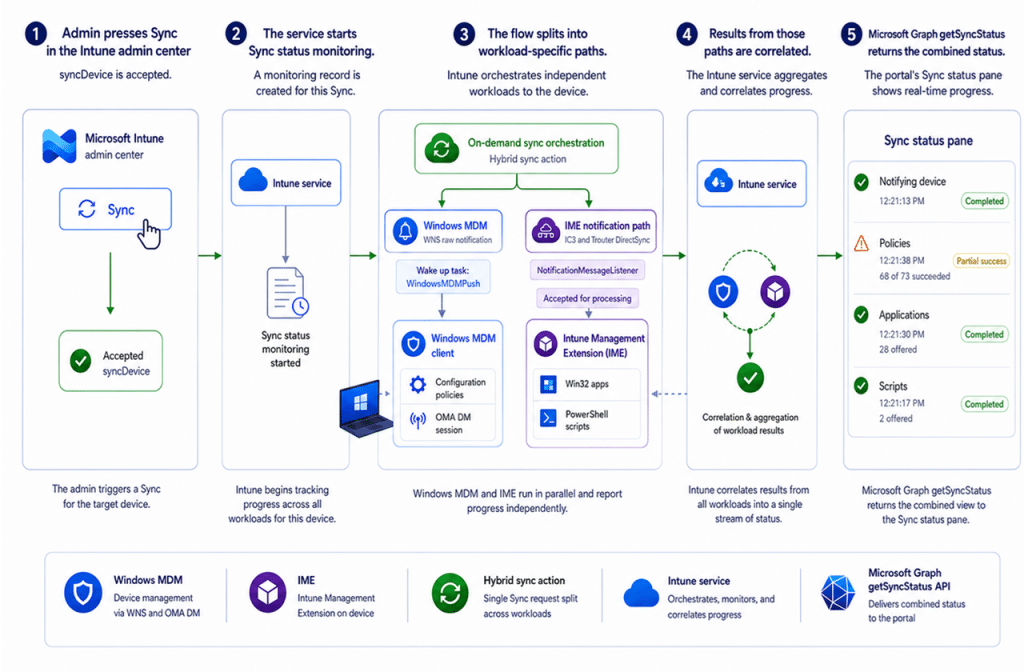
The Sync Window pane is therefore best understood as a summarized service view. It is not a direct log viewer, and it is not a one-to-one mirror of every individual action on the device.
Breaking the main Sync Status Window flow into smaller parts
The high-level flow is useful, but it becomes much easier to explain once it is broken into smaller pieces. The next diagrams zoom in on the portal sequence, the split between Windows MDM and IME, the Policies row, and the Applications and Scripts rows.
1. From Sync click to live monitoring
The first part is fully portal-side. The browser executes the syncDevice command, the service accepts the action, a monitoring record is created, and the new Sync Status Window opens. Only after that does the polling loop begin with a 4 hour timeout.
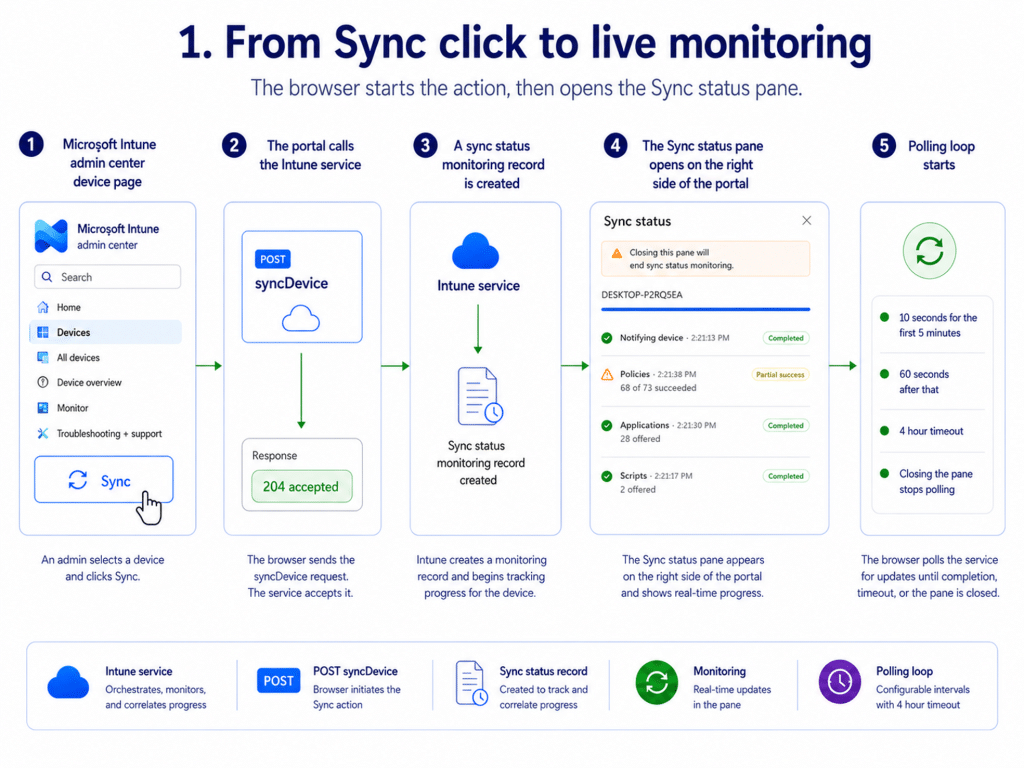
That distinction matters during troubleshooting. A successful syncDevice response only proves that the request was accepted. It does not prove that every workload has already started or completed.
2. One Sync action splits into two notification paths/worlds
What looks like one action in the portal is delivered through two different device-side paths (the 2 worlds I have been talking about). Windows MDM is still woken through WNS and the WindowsMDMPush task. IC3 is used to initiate a direct connection to the Intune management Extension.
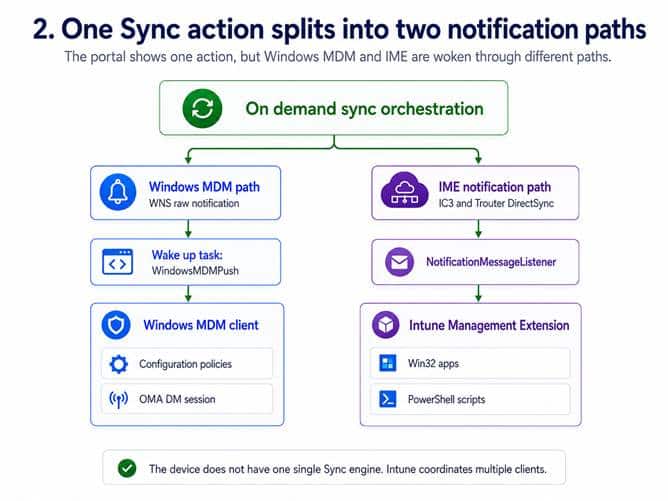
This split explains why the pane isn’t backed by a single Sync engine. Policies live on the Windows MDM side. Applications and Scripts live on the IME side.
The new Sync Status window is not counting Intune objects
The biggest challenge with interpreting the new Sync Status window is that the rows do not represent one-to-one mappings with objects that administrators see in the Intune portal.
A device can have an application assigned in Intune, but the way that application appears in Sync Status depends on which client is responsible for processing it.
This is the important distinction:
| Intune workload | Device-side processing engine | Sync Status row |
|---|---|---|
| Configuration profiles | Windows MDM | Policies |
| MSI Line of Business applications | Windows MDM / EnterpriseDesktopManagement | Policies |
| Web Links | Windows MDM | Policies |
| Win32 required applications | Intune Management Extension | Applications |
| Required Store / Enterprise App Catalog apps handled by IME | Intune Management Extension | Applications |
| Remediations | HealthScripts in IME | Scripts |
| Custom Compliance discovery scripts | HealthScripts in IME | Scripts |
| Platform PowerShell scripts | PowerShellScriptWorkload in IME | Depends on whether new policy data is returned |
This explains the behaviour we see in the Sync Status window. Two applications can both be called “applications” in Intune, but only one of them may increase the Applications counter. The difference is not the portal object type. The difference is the client-side engine processing the workload.
Where does the Policies number come from?
Now that we understand that Policies represents Windows MDM owned work, the next question becomes: how does Intune calculate the number shown in this row? In this example, the Sync Status window shows: 68 of 73 Policies succeeded
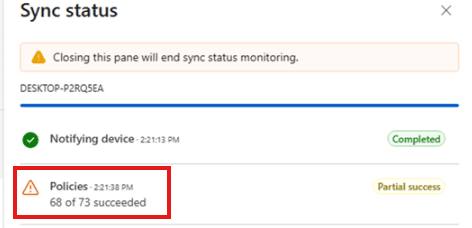
The first question is obvious. Where does the number 73 come from? To answer that, we first need to understand what the Policies row represents. This part of the Sync Status experience belongs to the Windows MDM path. During a sync operation, Windows receives the notification, the MDM stack wakes up, an OMA DM session is created, and Windows processes the requested management operations. The resulting status information is then returned back to Intune, where the service exposes the summary through the Sync Status experience.
At first, it is tempting to assume that the Policies number is simply the number of Device Configuration policies assigned to the device. However, the first piece of evidence already shows that the story is slightly different. When opening Device Configuration status for the same device, Intune calls the Graph report:
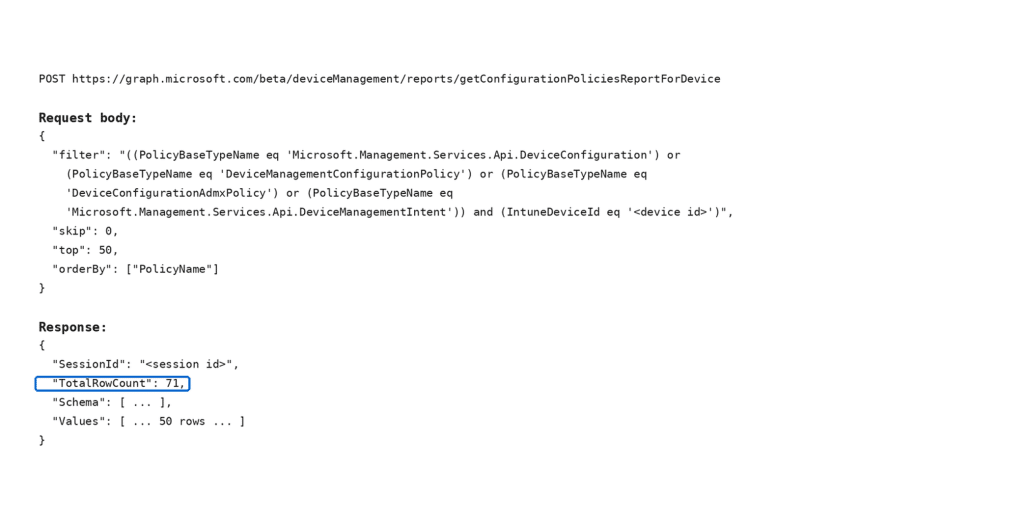
The response returns: TotalRowCount: 71. That same number is also visible in the Device Monitor experience.
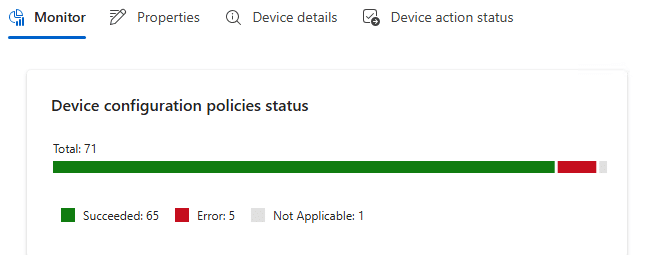
So we can confidently say that 71 represents the Device Configuration reporting count for this device. Please Note: A policy can appear multiple times in the report because Intune reports the result per processing context, such as device or user scope.
The question then becomes: If Device Configuration reports 71, why does Sync Status show 73? Is Windows creating two additional policies locally? Are there hidden Policy CSP objects involved?
To answer that question, we moved from the portal into the device-side evidence. Debug logging was enabled and the DMEDP Event log was exported to XML. The trace showed Windows actively processing Policy CSP settings during the OMA DM session. The capture contained 356 Policy GetValue operations covering 89 unique Policy CSP paths. Each of those paths was read four times during the trace.
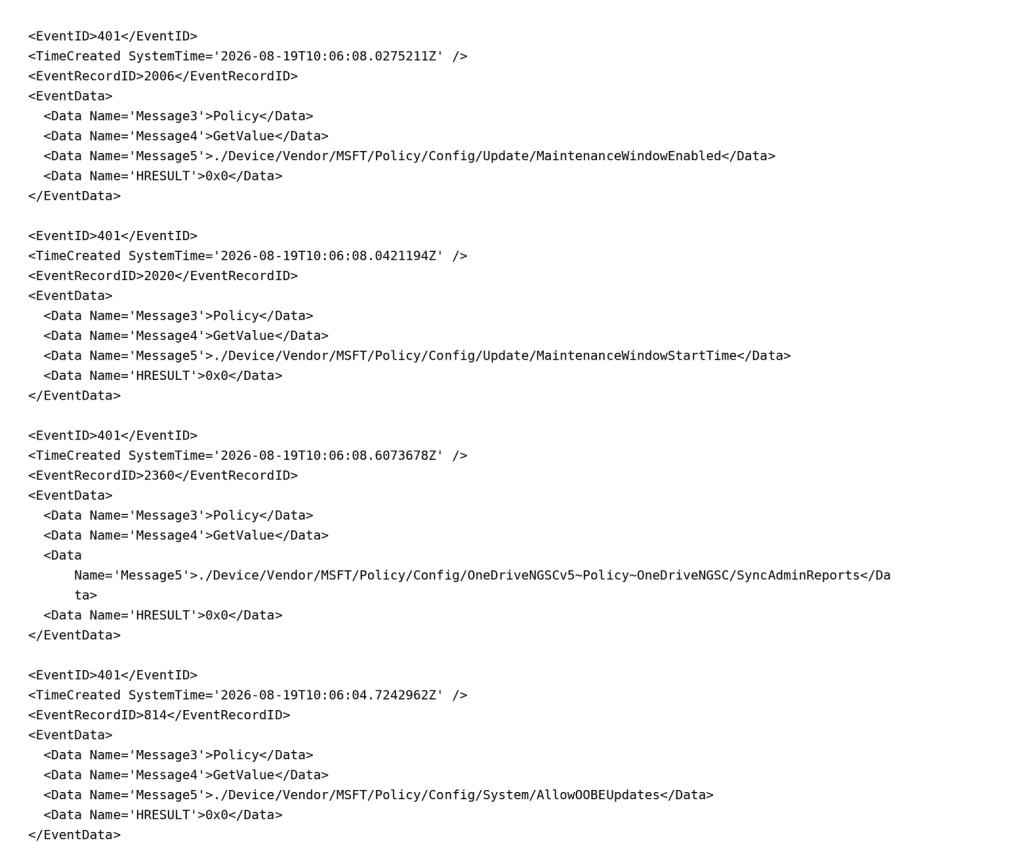
This tells us something important. The Sync Status number is not a simple count of Policy CSP reads performed by Windows. The device is not looking at those 356 operations and turning them into either 71 or 73. The additional two entries are not being created because Windows suddenly discovered two extra Policy CSP paths. So where do they come from?
The answer appears to be that Sync Status is not showing exactly the same dataset as the Device Configuration report. The Device Configuration report is showing configuration policy reporting. The Sync Status Policies counter appears to represent a broader Windows MDM result set. This also explains another observation from testing. When adding a traditional MSI Line of Business application, the Policies counter changed from 70 to 71, while the Applications counter remains untouched.
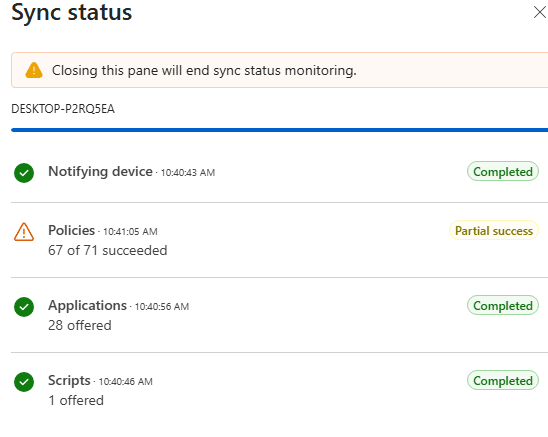
That MSI application is NOT processed by the Intune Management Extension. It belongs to the Windows MDM EnterpriseDesktopManagement path. This means the Policies row is not simply a configuration profile counter. It is a summary of Windows MDM owned work that Intune combines into the Sync Status experience….. and MSI/Lob Apps are deployed to your device using a CSP (AKA a policy)

The Policies number appears to represent Windows MDM-owned workload results returned to Intune during the Sync operation. Configuration policies are part of this count, but the MSI experiment shows that the bucket is broader than configuration profiles alone.
Zoom in on Applications and Scripts
Applications and Scripts both sit on the IME side of the Sync operation, but they aren’t handled by a single workload engine. The latest device logs make the “offered” numbers much easier to explain because the same counts appear inside IME during the exact DirectSync session.
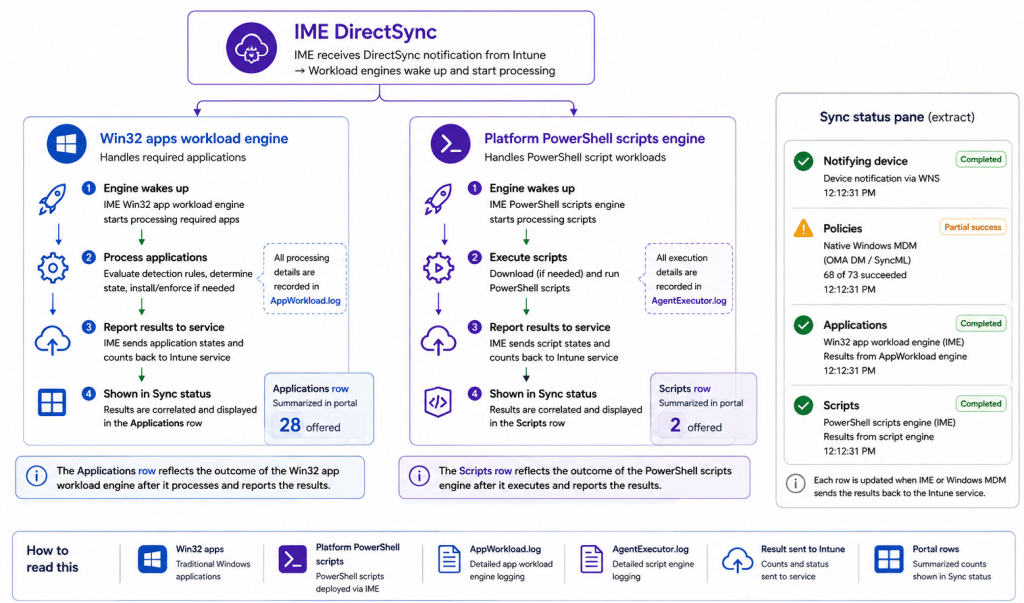
Where does the Application number come from?
The Sync Status pane showed 28 applications offered.
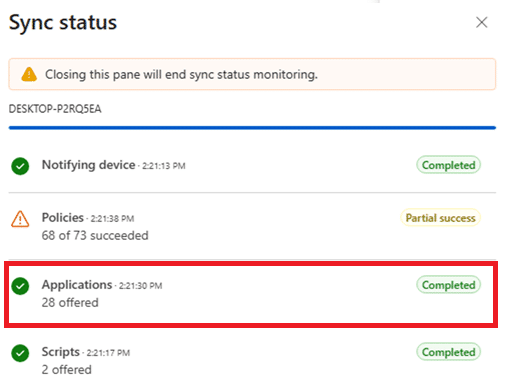
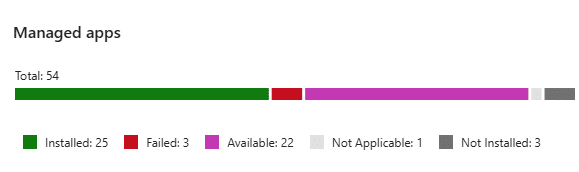
While the Managed Apps report is showing only a couple more.
So let’s examine what applications are counted and shown in the new status sync window. To do so, we need to examine the AppWorkload log on the device itself. When triggering the sync, the IME first requests the required apps. Intune then returns 28 Win32 app objects, and the V3 processor starts processing 28 subgraphs. A few hundred milliseconds later, it finishes those same 28 subgraphs.
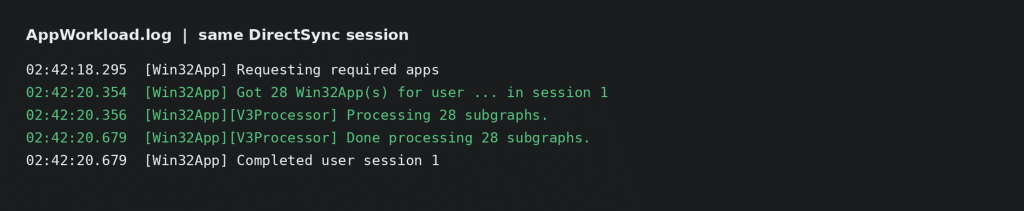
The 28 in the portal match the 28 Win32 app objects returned to IME and the 28 app subgraphs evaluated by the V3 processor. This makes the Applications counter fairly clear. “28 offered” does not mean 28 applications were installed. It means the IME needs to check the 28 object it is responsible for. This means it will check the REQUIRED Win32Apps,EAM Apps and Store Apps (WinGet). MSI/LOB apps are not included!
Scripts: the counter is broader than Platform scripts
The Scripts row showed 2 offered.
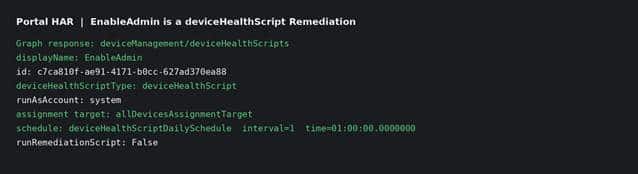
During the same DirectSync notification, the IME explicitly wakes Proactive Remediation and the regular PowerShellScriptWorkload. HealthScripts then sends a GetScript request and receives exactly 2 script objects. The local scheduler resolves exactly 2 policies.
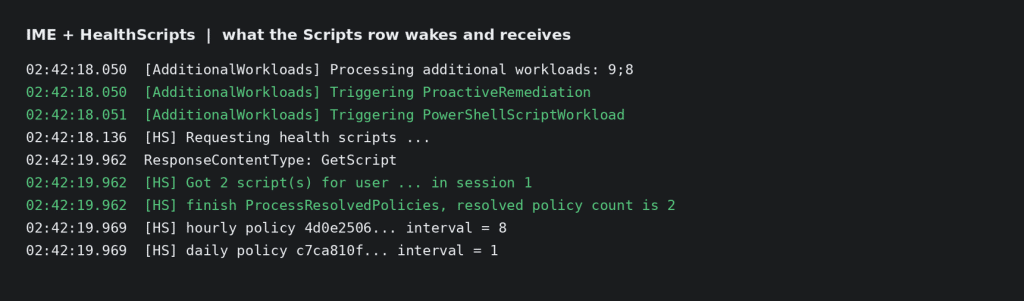
The same DirectSync notification wakes both script-related workloads, while HealthScripts receives and resolves exactly two script policies. Those two objects are not simply two Platform PowerShell scripts. One of them is the EnableAdmin Remediation
The second HealthScripts policy is PolicyType 8 and returns structured compliance-style JSON, which clearly shows it is connected to the Custom Compliance policy I created for BitLocker.
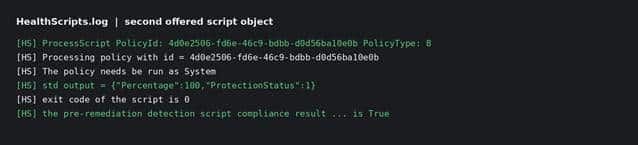
SO the 2 Scripts that are offered are a PowerShell Remediation Script and Health Script… why? Because they can be executed once more, while PowerShell Platform scripts are only executed once.
But DirectSync also wakes Platform scripts
The regular PowerShellScriptWorkload is definitely triggered as part of the same DirectSync. On this device, IME already has eight Platform script policy results and sends them in its PolicyRequest. Intune returns an empty PolicyResponse, so there were no NEW Platform script policies offered during this particular sync.
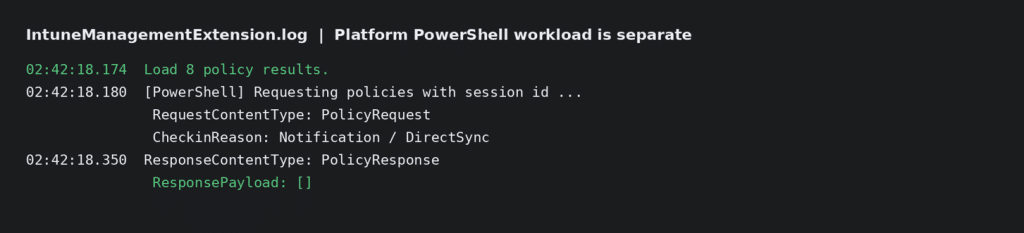
This is why the Scripts row should not be described as the Platform scripts blade. In this capture, the value of 2 lines up with the two HealthScripts objects returned by GetScript, while the regular Platform script workload separately reports eight existing policy records and receives no new policy payload.
A cleaner way to read the counters
DirectSync
|
+– Win32 App Workload
| -> Intune returns 28 Win32 apps
| -> Applications: 28 offered
|
+– HealthScripts
| -> GetScript returns 2 policies
| -> Remediation + custom compliance style discovery
| -> Scripts: 2 offered
|
+– PowerShellScriptWorkload
-> 8 existing results sent
-> PolicyResponse []
-> 0 new Platform scripts offered
Offered does not mean executed
The HealthScripts response returned two policies, but IME did not immediately launch two PowerShell processes because Sync was clicked. After resolving the two policies, HealthScripts checks their existing state and schedule. One policy uses an eight hour interval and EnableAdmin uses a daily schedule. The number is therefore closer to “script policies offered for evaluation” than “scripts executed now”. The same idea applies to applications.
Where is Compliance?
The current Sync Status Window appears to stop after Scripts, but the getSyncStatus response for the same Sync operation still contained a Compliance component. At that moment the service reported Compliance as inProgress. That gives us the missing clue: Compliance was not skipped. The portal was still tracking it, but it was not rendering the row yet.
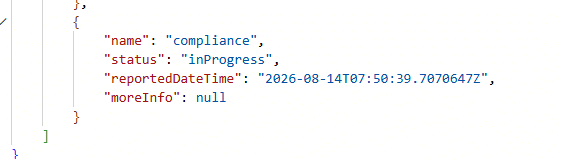
The Intune portal code confirms why the row disappears. Compliance is one of the normal stages in the model, but the display filter only keeps the Compliance row once its normalized status is success or failure. An inProgress Compliance stage therefore exists in the model and can keep the monitor active while remaining invisible in the pane.
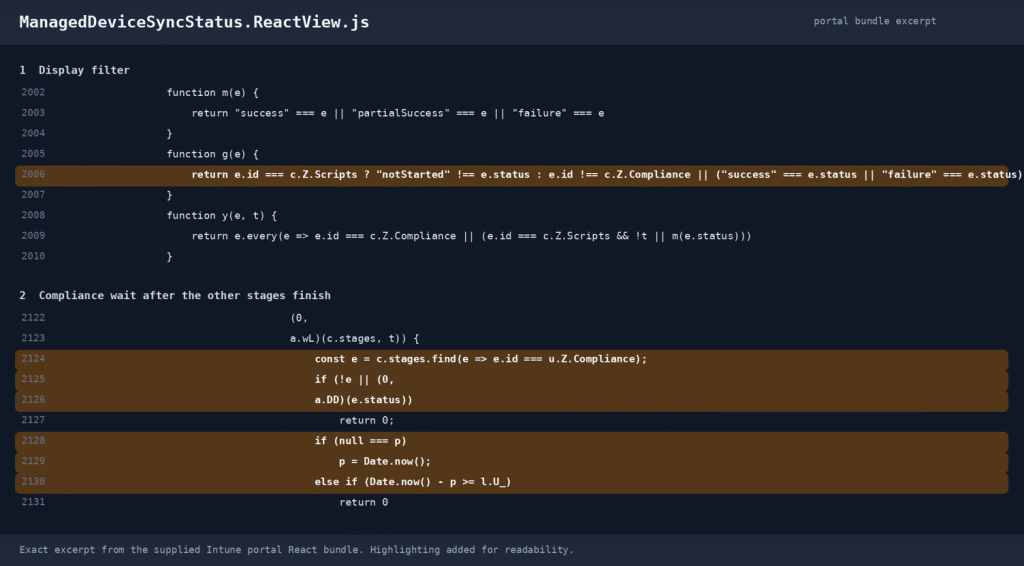
This also explains the full blue progress bar in the capture. The portal calculates progress from the stages that survive the display filter. If Compliance is still in progress and therefore hidden, Notifying device, Policies, Applications, and Scripts can all be in final states and the visible progress bar can reach 100 percent while Compliance is still running behind the pane.
The polling logic does not stop immediately when that happens. Once the other stages have reached a final state, the view explicitly looks for Compliance and gives it a separate 90 second wait to finish. If Compliance later returns a final state such as Compliant, In grace period, Not applicable, or Managed by Configuration Manager, the portal presents that as a successful Compliance result. Other final Compliance results are presented as failure.
How to read the Sync Status counters
The easiest way to read the Sync Status window is not by looking at Intune object types. The same object type can end up in a different row depending on which Windows component processes it. The counters follow the processing engine, not the category shown in the Intune portal.
| Sync Status row | Which Windows world processes it? | Where does the data come from? | What we can explain today |
|---|---|---|---|
| Policies | Windows MDM | MDM policy processing results returned to Intune during the Sync operation | Includes Windows MDM owned workloads. Device Configuration policies are part of this number, but the MSI LOB experiment shows this is broader than configuration profiles alone. |
| Applications | Intune Management Extension | Required application objects returned to the IME application workload | The number maps to application objects offered to IME for evaluation. In this capture, 28 matches the Win32 app objects returned and the 28 application graphs processed by the V3 processor. |
| Scripts | Intune Management Extension | Script objects returned to IME script workloads | The number represents script policies offered to IME. In this capture, the 2 objects came from HealthScripts: a Remediation and a Custom Compliance discovery script. |
| Compliance | Service-side compliance tracking | Compliance state tracked by the Sync Status service model | Compliance can exist in the backend state even when the row is not visible because the UI only displays certain normalized states. |
| Notifying device | Sync notification flow | Start of the device notification process | Confirms the service started the sync request. It does not prove that workloads completed. |
Closing thoughts
The Sync Status window becomes much easier to understand once the counters are linked to the workload that processes them.
Policies represents Windows MDM processed workloads. This includes configuration policies and other MDM based workloads such as MSI Line of Business applications and Web Links. The number should be interpreted as Windows MDM work reported back to Intune, not simply the number of configuration profiles assigned.
Applications represents application objects offered to the Intune Management Extension for evaluation. The number does not mean applications were installed. It shows how many required application objects were handed to IME during that Sync operation. This includes Win32App/EAM/Store apps
Scripts represents script objects offered to IME script workloads. The number should be interpreted as scripts available for evaluation, not necessarily scripts that executed immediately.
The Sync Status window is therefore best viewed as a combined status view of different Windows management workloads.
The Sync Status window is therefore best viewed as a combined status view of different Windows management workloads. The counters make sense once you understand which client is responsible for processing the work.